Scrape Glovo Food Delivery App Data to Analyze User Behavior Trends in 2025
Published on September 24, 2025
Introduction
In today’s hyper-competitive online delivery ecosystem, knowing what customers want—and when—is half the battle won. With platforms like Glovo rapidly expanding across Europe, Latin America, and Africa, gaining access to real-time food delivery data can help uncover critical consumer trends, drive data-driven product decisions, and enable hyperlocal business strategies.
This blog presents a comprehensive guide to scraping Glovo app data to analyze user behavior trends in 2025. We’ll break down:
- What kind of data to collect from Glovo
- How to scrape it responsibly using Python
- What behavioral insights you can extract
- How businesses, marketers, and data scientists can use this data for actionable intelligence
1. Why Analyze Glovo User Behavior?
As delivery apps dominate food consumption in urban areas, platforms like Glovo have become windows into:
- Real-time consumer preferences
- Local market demand
- Peak ordering times
- Preferred cuisines, price points, and combos
By analyzing Glovo data, you can:
- Identify bestselling products by city or time
- Compare vendor ratings and customer feedback
- Understand delivery wait times and surge patterns
- Benchmark competitor offerings in your niche
2. What Glovo Data Can Be Scraped?
Though Glovo doesn’t offer a public API, much of its app interface data is accessible via browser or app-based scraping. Key datasets include:
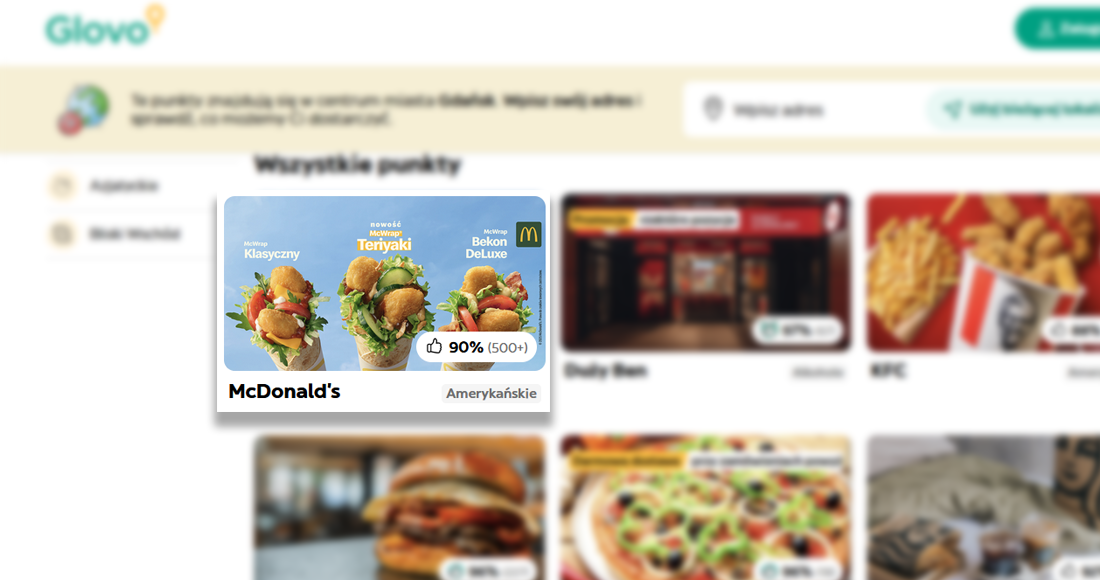
Vendor and Product Listings
- Restaurant/Store name
- Cuisine/Category
- Menu item names and prices
- Promotions and discounts
- Estimated delivery time
- Delivery fee
User Feedback and Ratings
- Ratings (1–5 stars)
- Number of reviews per store
- Top keywords from reviews (e.g., “cold food,” “on time,” “great packaging”)
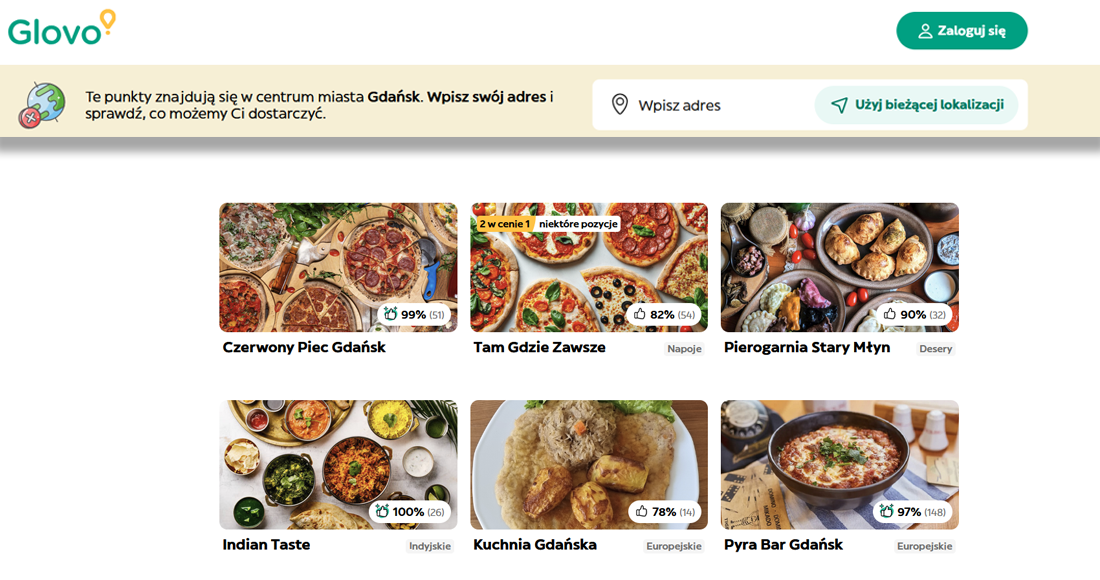
Geospatial Data
- Availability by pin code or GPS coordinates
- Dynamic pricing by location
- Popular restaurants in specific regions
Temporal Data
- Peak delivery hours by cuisine
- Weekend vs. weekday menu behavior
- Time-sensitive promo codes and flash deals
3. Ethical Considerations & Legal Notes
Before scraping Glovo:
- Check their robots.txt and terms of service
- Do not overload their servers with aggressive scraping
- Use the data only for internal analysis, not for redistribution
- Prefer official APIs or partnerships where possible
4. Tools Required for Scraping Glovo
| Tool/Library | Purpose |
|---|---|
| Python 3.x | Scripting language |
| Selenium | Automate browser for dynamic loading |
| BeautifulSoup | Parse HTML |
| Requests | Handle direct API endpoints |
| Pandas | Organize scraped data |
| Geopy / JSON | For location and metadata enrichment |
| Matplotlib / Seaborn | For trend visualizations |
5. How to Scrape Glovo App Data
Step 1: Find a City or Region
Go to: https://glovoapp.com
Change the location to a target city like Barcelona, Warsaw, or Buenos Aires. Inspect the network tab (in Chrome DevTools) to find data fetching endpoints.
Step 2: Capture Restaurant Listings
from selenium import webdriver
            from bs4 import BeautifulSoup
            import time

            driver = webdriver.Chrome()
            driver.get("https://glovoapp.com/es/barcelona/")

            # Scroll to load more results
            for _ in range(5):
                driver.execute_script("window.scrollTo(0, document.body.scrollHeight);")
                time.sleep(2)

            soup = BeautifulSoup(driver.page_source, 'html.parser')
            driver.quit()
Step 3: Extract Data
restaurants = soup.find_all('div', class_='vendor-item')

            data = []
            for res in restaurants:
                try:
                    name = res.find('h3').text
                    cuisine = res.find('div', class_='vendor-category').text
                    delivery_time = res.find('div', class_='delivery-time').text
                    rating = res.find('div', class_='rating-score').text

                    data.append({
                        'Name': name,
                        'Cuisine': cuisine,
                        'Delivery Time': delivery_time,
                        'Rating': rating
                    })
                except:
                    continue
Step 4: Save and Analyze
import pandas as pd

            df = pd.DataFrame(data)
            df.to_csv("glovo_data_barcelona.csv", index=False)
Repeat this process for multiple categories and cities.
6. User Behavior Trends to Analyze in 2025
6.1 Most Popular Cuisines by City
Compare the top 3 cuisines by vendor count or rating in:
- Barcelona
- Madrid
- Warsaw
- Lima
Use filters like:
df['Cuisine'].value_counts().head(5)6.2 Discount Patterns & Price Elasticity
Check which vendors offer:
- Free delivery
- %-based discounts
- Combo meals
And correlate them to rating or popularity.
6.3 Delivery Time Impact on Ratings
Build a scatter plot of:
- Delivery time vs. ratings
- High-rated vendors with fast delivery
This reveals customer expectations in 2025 about speed.
6.4 Regional Preferences
- Track which food types dominate in which geography
- Understand local vendor density
- Detect unserved or overserved cuisines
6.5 Review Text (if scraped)
If accessible, extract common keywords from user reviews:
- "Too cold," "always on time," "packaged well"
Use TextBlob or NLTK for:
- Sentiment analysis
- Keyword extraction
7. Business Use Cases
A. Restaurant Chains
- Spot delivery weaknesses of top-rated competitors
- Launch price-matching offers
- Target delivery areas with low service but high demand
B. FMCG Brands
- Understand which grocery products are trending
- Time discounts based on peak delivery hours
- Partner with top-rated dark stores
C. Logistics Startups
- Optimize delivery routes in real-time using Glovo vendor map
- Use store clustering to improve zone planning
D. Investment & Market Research
- Identify cities with growing Glovo activity
- Predict demand surges (e.g., Friday pizza spike)
- Model expansion strategies for Q-commerce platforms
8. Future Outlook: Glovo Behavior Trends in 2025
| Trend | Prediction |
|---|---|
| Hyper-personalized menus | Data shows users prefer tailored recommendations |
| AI delivery time estimates | Ratings now correlate more with time than price |
| Dark kitchen dominance | Ghost kitchens outperform traditional restaurants |
| Ethnic cuisine growth | Users crave global flavors, especially in urban zones |
| Fast grocery uptick | 15-minute delivery is becoming a baseline |
9. Challenges You May Face
| Challenge | Workaround |
|---|---|
| Glovo blocks scraping | Use rotating user agents and delay patterns |
| JavaScript-loaded content | Selenium or Puppeteer is required |
| Country-specific domains | Use proxies for region-specific content |
| Duplicate vendors | Clean with store ID or lat/long coordinates |
10. Conclusion
In 2025, where real-time consumer intelligence is gold, scraping Glovo data helps you:
- Track live ordering behavior
- Monitor restaurant popularity trends
- Optimize your delivery and marketing strategies
From food brands and local vendors to Q-commerce startups and VC firms, Glovo data offers insights that fuel smart business decisions.
With responsible scraping, smart tools like Python, and a sharp focus on behavioral metrics, you can turn raw delivery data into strategic power.
